Key Points
-
Natural language processing (NLP) can extract investment signals from unstructured text that aren’t already captured by traditional factors like value, quality, momentum, and low volatility.
-
Unlike news sentiment, year-over-year textual change in SEC filings is a slow-moving, durable signal that investors can use to potentially enhance long-horizon factor strategies.
-
The signal's persistence may be supported by three drivers that technology doesn't easily erode: limited investor attention, management incentives to bury bad news in revised filings, and compensation for the genuine uncertainty signaled by meaningful rewrites.
-
The signal is most useful as a value-trap filter: it has historically produced the strongest return spread among stocks that already look risky on conventional measures — the cheap, aggressively investing, unprofitable, high-volatility, and low-momentum segments.
Que Nguyen is the corresponding author.
Introduction
When it comes to systematic investing, numbers tell only part of the story. Traditional quantitative models rely on prices, earnings, and balance sheet data, but words matter too. News articles, SEC filings, earnings call transcripts, and social media all help shape how markets value companies. With online text expanding at a staggering pace and computing power advancing just as quickly, natural language processing (NLP)—the technology that lets computers read and interpret human language—has become an increasingly relevant and valuable tool in modern investment management.
Transforming Text into Investment Signals
The idea that words can move markets isn’t new, but quantifying it took time. The first solid evidence came almost two decades ago when Tetlock (2007) demonstrated that pessimistic coverage in The Wall Street Journal predicted short-term downward pressure on stock prices.
From there, researchers kept finding signals the numbers missed.1 Feldman et al. (2010) showed that tonal shifts in management discussion and analysis (MD&A) sections forecast returns even after controlling for earnings surprises.2 In a paper aptly titled "Lazy Prices," Cohen, Malloy, and Nguyen (2020) found that when firms meaningfully changed their 10-K text year over year, the stocks underperformed for the next six months. The implication: investors simply weren't reading carefully enough.
Today the field has entered the era of large language models (LLMs). Lopez-Lira and Tang (2023) demonstrated that modern AI models significantly outperform dictionary-based methods at interpreting financial news, and researchers are now building entirely new fundamental factors from qualitative disclosures — Eisfeldt et al. (2026), for example, parse 10-K language to construct an "intangible intensity" metric that captures investment the financial statements miss.
Our Approach: Building a Signal That Lasts
The dominant NLP application in investment management targets short-term trading, with daily news sentiment driving moves that play out over hours or days. That’s not much use to long-term factor investors, who need durable, slow-moving signals.
The dominant NLP application in investment management targets short-term trading, with daily news sentiment driving moves that play out over hours or days. That’s not much use to long-term factor investors, who need durable, slow-moving signals.
This article takes a different path, focusing on SEC 10-K and 10-Q filings. Unlike daily news, these are dense regulatory disclosures that reveal lasting information about a company’s trajectory. We constructed our signal using the full history (since mid-1990s) of filings from the SEC’s Electronic Data Gathering, Analysis, and Retrieval (EDGAR) database, converting the raw HTML to plain text.3
We chose a simple metric: the Jaccard similarity score (formal definition in the appendix). It asks a single question: Of all the unique words used across two filings, what fraction appears in both? A score of 1.0 means identical vocabulary; 0.0 means no overlap. A lower score means that management has substantially rewritten its language compared to the same quarter a year earlier — a pattern that the “Lazy Prices” research linked to weaker future stock performance.4 Using this transparent measure, we test whether filing language changes contain information not already captured by traditional factors, such as value, quality, momentum, and low volatility.
Read more: Records on the Tape. Savings at a Three-Year Low.
Case Study: Citigroup on the Eve of the Financial Crisis
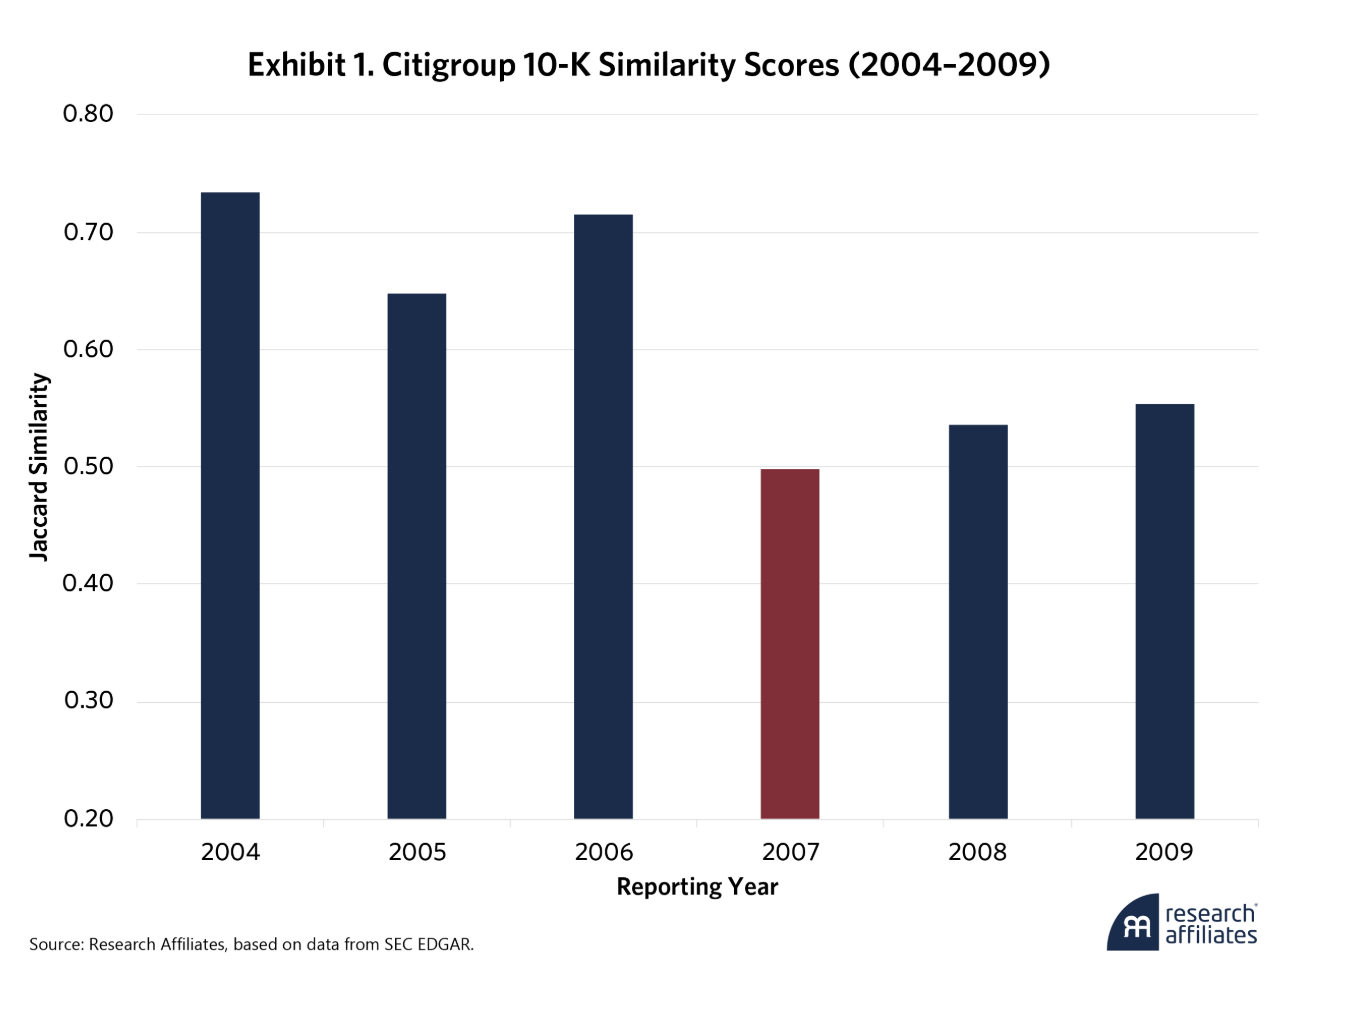
To see what this signal looks like in practice, consider Citigroup's 2006 and 2007 10-K filings. By the time Citigroup filed its 2007 10-K on February 22, 2008, the subprime crisis had been unfolding for months, and Citigroup's filing reflected unusually heavy exposure to it. The company stopped using the “return on risk capital”5 metric it had prominently reported in prior years and added cautionary language to the “Risk Factors” section about how it was valuing its trading portfolios. It also flagged the potential impact of rating agency downgrades — both highlighted in the appendix excerpts.
The structural changes were just as telling. Citigroup consolidated its MD&A, collapsing subsegments (e.g., U.S. Cards, U.S. Retail Distribution, U.S. Consumer Lending, and U.S. Commercial Business) into broader top-level segments (e.g., U.S. Consumer). It added a new section titled "Exposure to Real Estate" and expanded the off-balance-sheet discussion to cover subprime exposures, CDOs, and leveraged loans. All told, Citigroup's Jaccard similarity score dropped sharply—from 0.72 for the 2006 10-K to 0.50 for the 2007 10-K (Exhibit 1).

Critically, these changes were specific to Citigroup. The 2007 filings of other large U.S. banks (JPMorgan Chase, Goldman Sachs, Morgan Stanley, and Bank of America) showed only modest year-over-year changes, and their similarity scores actually rose slightly. The signal was picking up firm-specific risk, not sector exposure.
In Citigroup's case, the signal proved prescient. The bank struggled throughout 2008 and faced a severe crisis of confidence by late fall, requiring three separate government rescues over the following months.6 Despite these unprecedented measures, Citigroup's stock fell below $1 for the first time in its history on March 5, 2009.
Applying the Signal Broadly
A single case study, however striking, proves nothing on its own. To test whether filing language changes predict returns more broadly, we ran a straightforward experiment on 30 years of data for the 1,000 largest U.S. stocks by market capitalization, covering the period from April 1995 to September 2025.
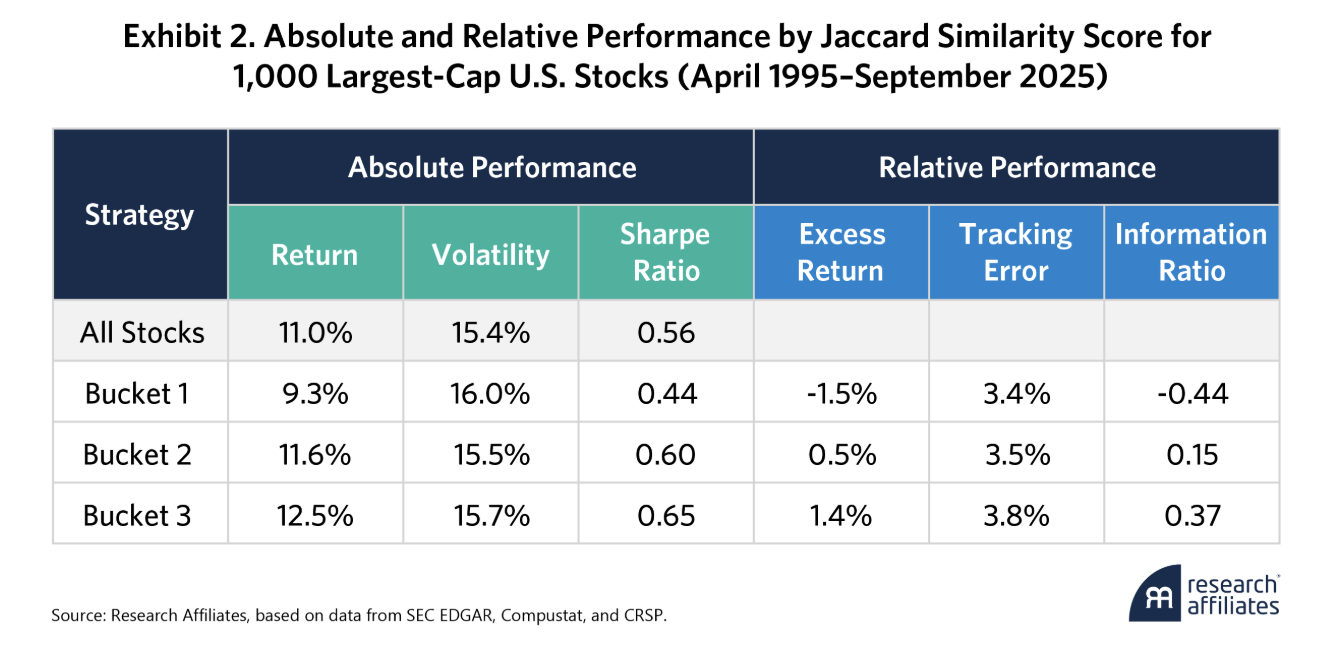
Each quarter, we ranked every stock by its most recent similarity score and sorted them into three equal buckets. Bucket 1 held the big changers (lowest similarity scores—lots of new language). Bucket 3 held the steady-language companies (highest similarity—mostly unchanged filings), and Bucket 2 held everything in between. Each portfolio was market-cap weighted and rebalanced quarterly to align with the SEC reporting cycle.7 Exhibit 2 shows the performance of these buckets along with the universe of stocks for comparison.
The results are clear. Companies with major changes in their filing language (Bucket 1) underperformed the benchmark by roughly 1.5% per year while those with stable language (Bucket 3) outperformed by 1.4% — an annual spread of nearly 2.9%. And remember: the benchmark is the same liquid universe of large-cap U.S. stocks.
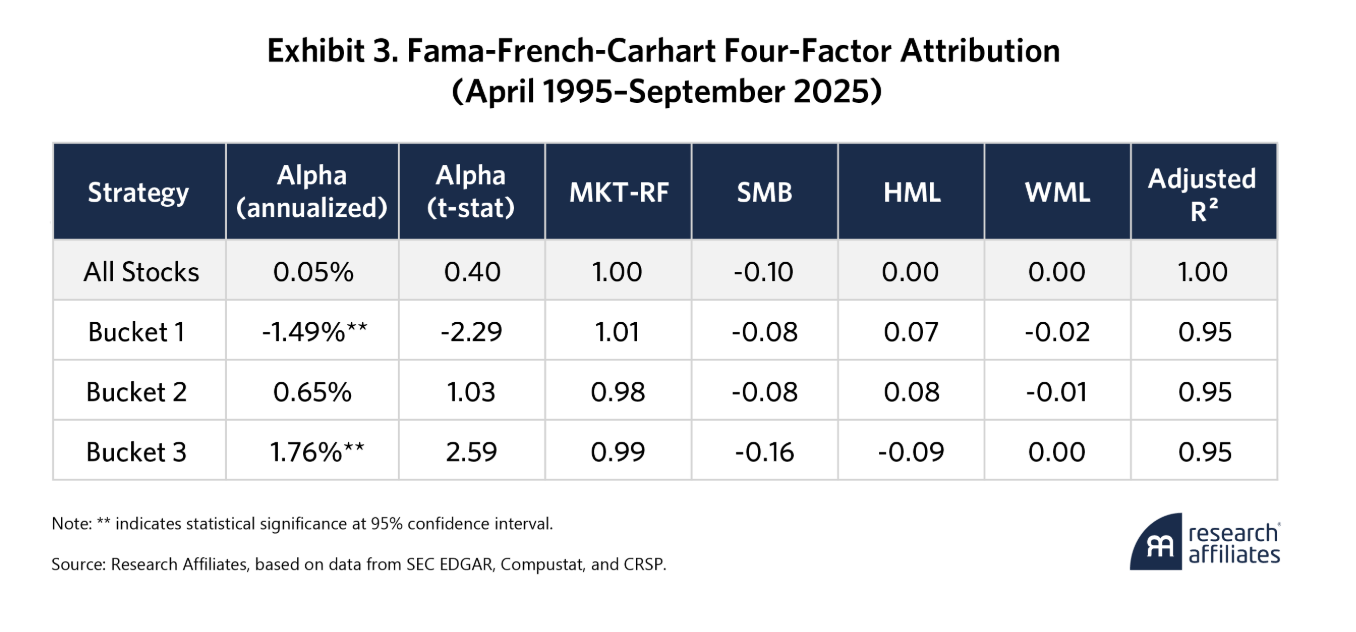
But couldn’t this just reflect the performance of companies that happen to look cheap, small, or trending? To check, we ran a standard risk-factor attribution to control for exposure to the market, company size, value, and momentum (the well-known Fama-French-Carhart four-factor model). Even after accounting for these exposures, the signal holds up, as shown in Exhibit 3. Bucket 1 delivers negative risk-adjusted returns (annualized alpha of –1.49%, t-stat of –2.29) while Bucket 3 delivers positive risk-adjusted returns (+1.76%, t-stat: 2.59). In other words, this signal isn’t just a recycled value or momentum bet — it’s genuinely new information.
Why Does This Signal Work?
If filing language is so predictive, why doesn't the market price it in immediately? We hypothesize that the persistence comes from three drivers: limited investor attention, asymmetric management incentives, and a genuine risk premium for the uncertainty signaled by meaningful rewrites.
Limited Investor Attention
A typical 10-K runs well over 100 pages of dense legal prose. When earnings are released, investors focus on the headline numbers (EPS, revenue growth, forward guidance), not on parsing risk disclosures for subtle wording changes. Reading filings carefully is tedious and expensive, and most investors don't do it. Textual information ends up being slow to reach stock prices.
Asymmetric Management Incentives
When news is good, companies market it through press releases, earnings calls, and social media; there's little reason to overhaul filing language. When news is bad, the incentives flip—lawyers have every reason to quietly update risk factors to protect against future lawsuits, leaning on the “safe harbor” provisions of the Private Securities Litigation Reform Act of 1995 (PSLRA).8 As a result, bad news tends to get whispered into revised filings rather than shouted from the rooftops. This asymmetry further reinforces investors’ limited attention to filings.
Compensation for Uncertainty
When companies overhaul their filings, they may be signaling genuine uncertainty about future outcomes, and investors could reasonably demand higher returns for bearing it. Even in a perfectly attentive market, big-changer stocks would carry some discount because the signal itself reflects elevated fundamental risk.
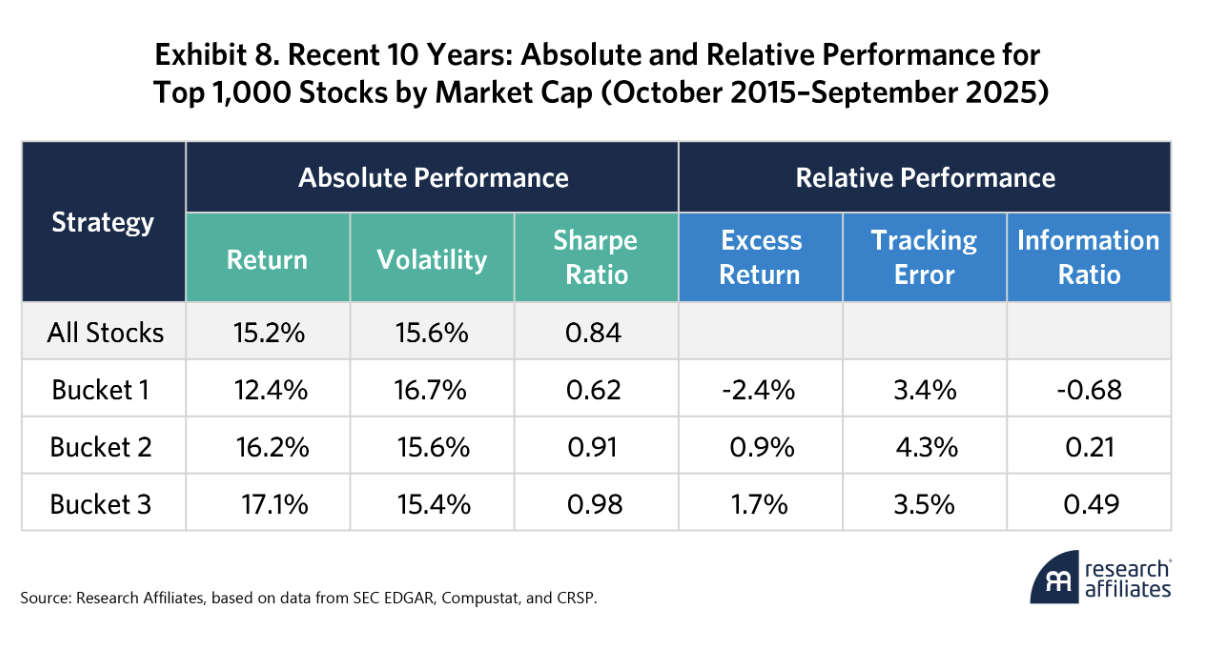
Does the Signal Hold Up?
A fair-minded skeptic might ask whether hedge funds and other active managers have already arbitraged this edge away after years of applying NLP to SEC filings. The evidence suggests otherwise. The original “Lazy Prices” study analyzed data through 2014. The out-of-sample period from 2015–2025 actually shows stronger results, with big changers (Bucket 1) underperforming by 2.4% per year and steady-language companies (Bucket 3) outperforming by 1.7% per year (see appendix).
The signal may persist because it sits in an awkward middle ground: too slow for statistical arbitrage desks and too subtle for most fundamental managers. Most NLP efforts in finance also focus on news sentiment rather than filing changes. And structural inattention to 100-plus-page legal documents may simply be outpacing arbitrage.
One caveat is that the past decade featured mega-cap outperformance, the pandemic shock, a rapid rate-hike cycle, and an AI-driven rally — a regime in which “steady language” companies (i.e., established large-cap stocks) may have enjoyed a stability premium. Still, earlier decades show positive results (see appendix), suggesting the effect is not regime specific.
Importantly, this signal is not designed to detect fraud or sudden collapses. Companies such as Enron, WorldCom and Silicon Valley Bank showed little warning in filing similarity because fraud actively conceals problems and liquidity crises can unfold rapidly between reporting cycles. The signal works when management is compelled to disclose deteriorating conditions over time. That narrower claim is also the more defensible one.
Signal Persists over Investable Horizons
For an investment signal to support long-horizon factor strategies, it needs to persist for months — not days. Our analysis of Exhibits 2 and 3 already showed that quarterly rebalancing works; let's zoom in on the actual rate of decay.
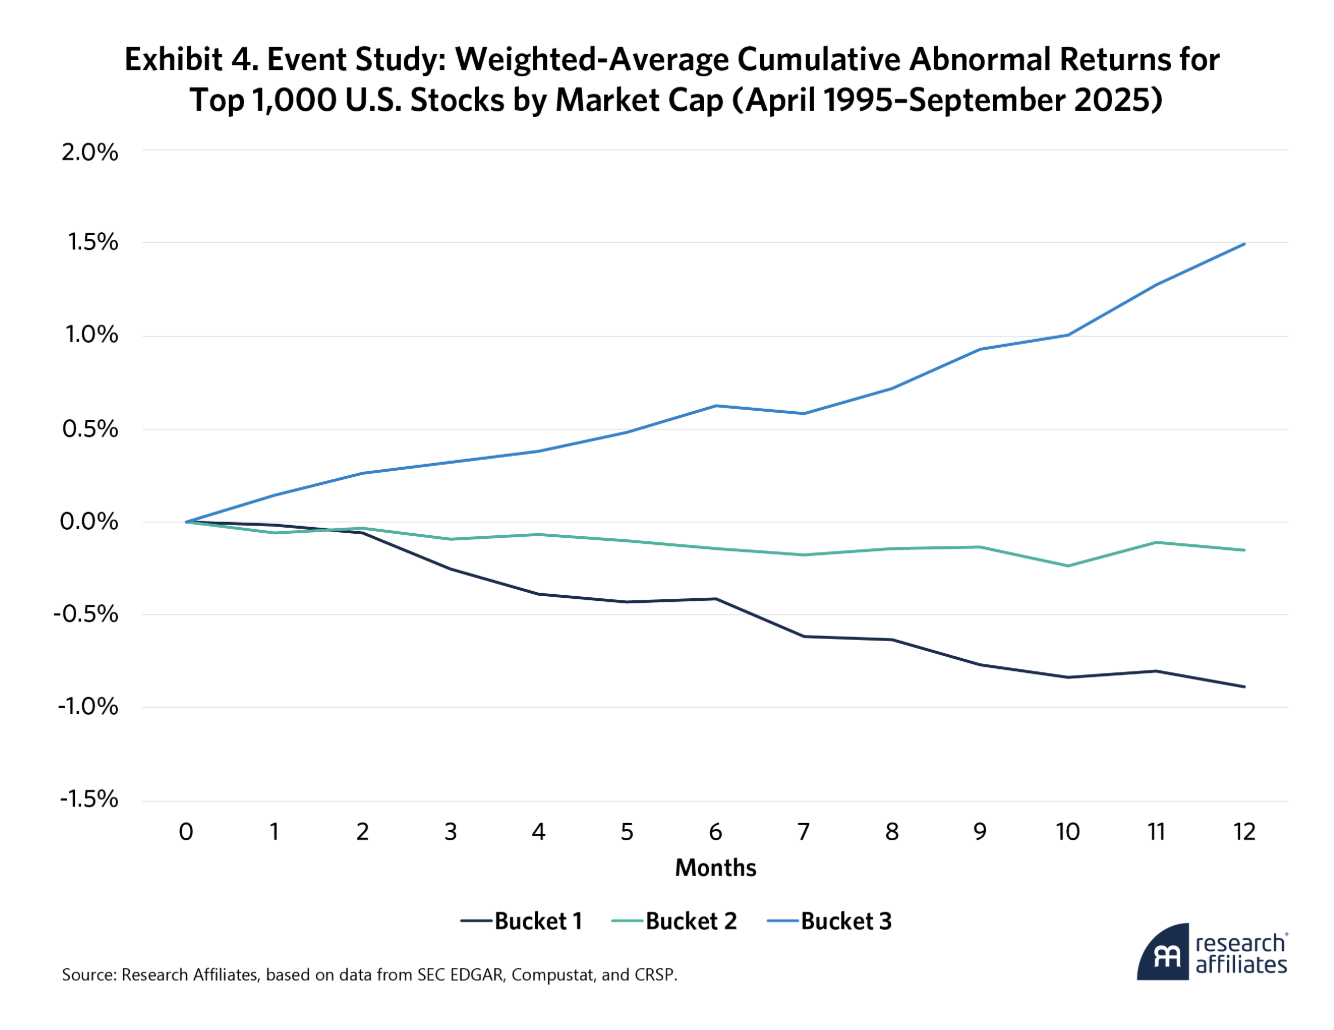
To measure the decay, we ran an event study. At the end of each month, we identified the set of stocks that had just released a filing, sorted them by similarity score, and tracked their 12-month cumulative abnormal returns (CAR)—that is, returns adjusted for the overall market and value-weighted within each bucket.9
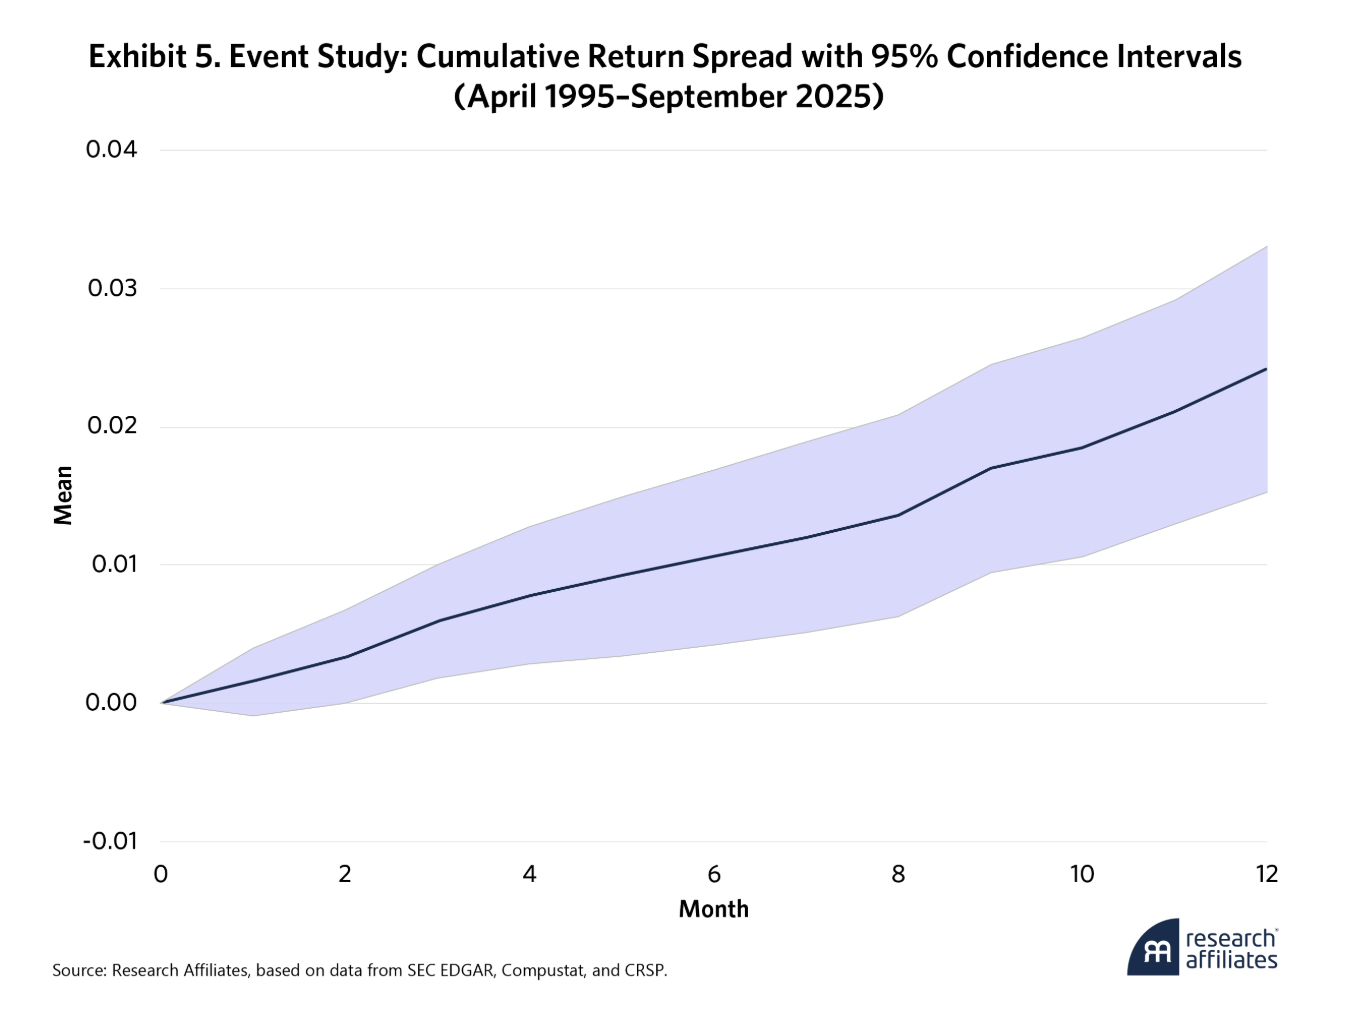
As shown in Exhibit 4, there is no sharp “announcement effect” when filings are released—the market doesn’t react immediately. Instead, prices drift slowly. Big changers (Bucket 1) keep underperforming for months while steady-language companies (Bucket 3) keep outperforming. The gap between the top and bottom buckets doesn’t close but actually widens for a full 12 months after the filing, as shown in Exhibit 5.
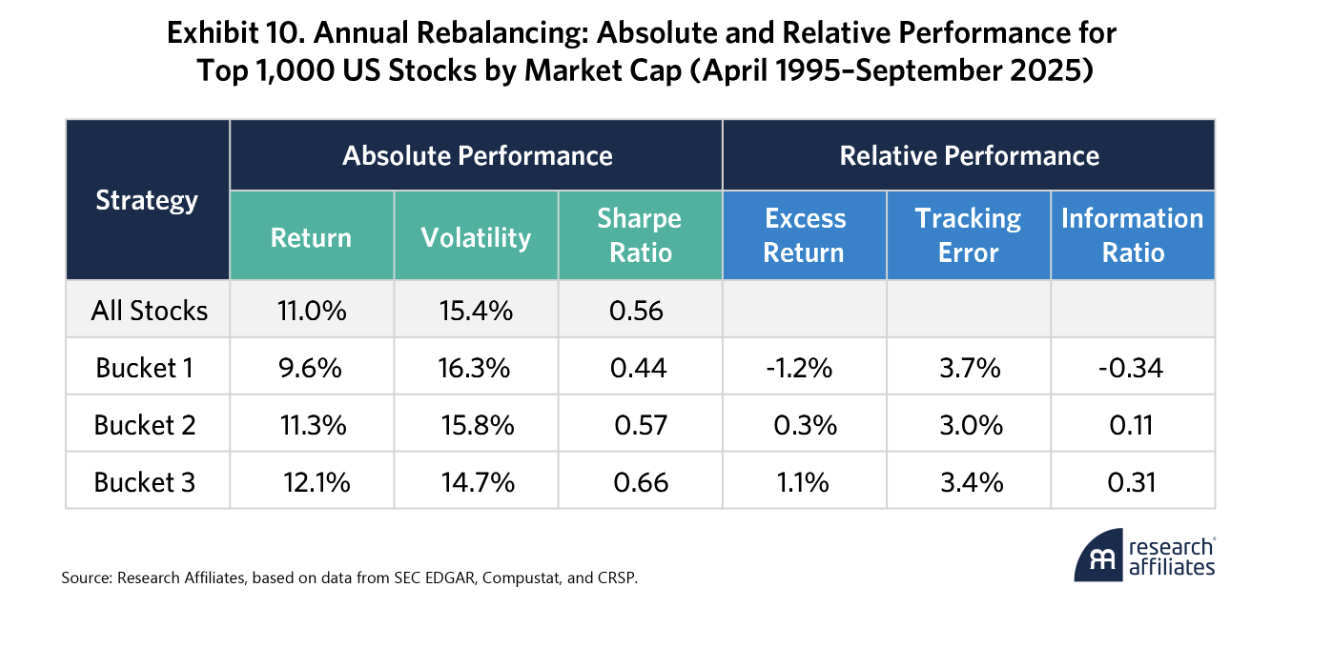
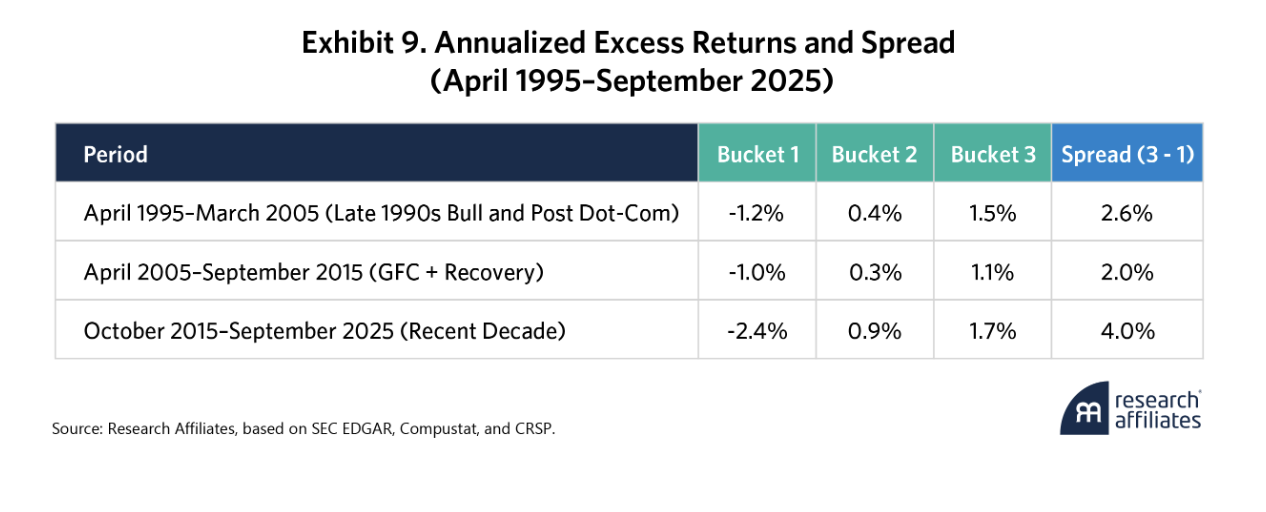
To test the outer limits of the signal’s horizon, we also modeled an annual rebalancing schedule (see appendix). The pattern holds, albeit with somewhat smaller magnitudes. Bucket 1 underperforms by 1.2% annually, and Bucket 3 outperforms by 1.1%. That compression is expected, since annual rebalancing means trading on older signals that can be more than a year out of date, depending on a company’s specific reporting schedule.
This takeaway is important. Unlike news sentiment, which decays in days, signals from SEC filings persist over months to a year — especially well-suited to low-turnover, long-horizon systematic strategies.
Unlike news sentiment, which decays in days, signals from SEC filings persist over months to a year — especially well-suited to low-turnover, long-horizon systematic strategies.
Does This Signal Overlap with Other Factors?
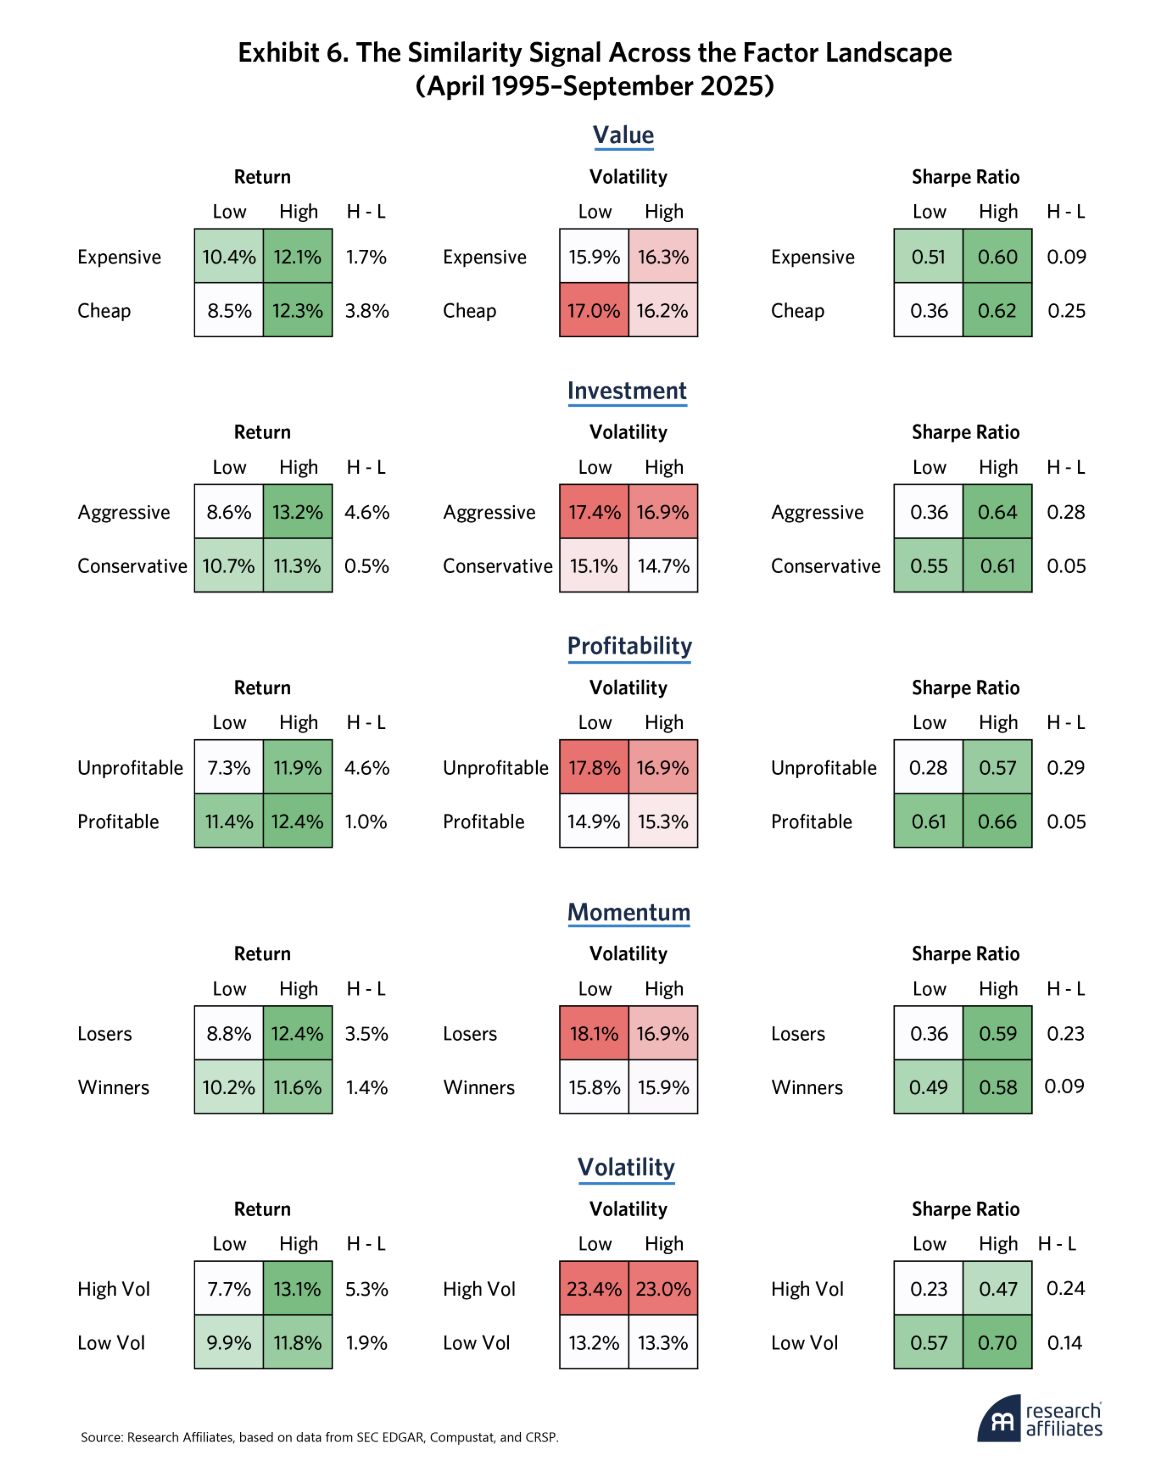
As indicated in Exhibit 3, the Fama-French-Carhart attribution shows that the signal isn't simply a repackaged factor bet. An investor’s natural follow-up question is more practical: Across the broader factor landscape, where does this signal add the most value and where does it add the least? To answer that, we tested how the similarity score interacts with five classic equity factors:
-
Value: Book to price.
-
Investment: A blend of book, inventory, and asset growth.
-
Profitability: A blend of gross, operating, and cash-based operating profitability.
-
Momentum: 12-month return, excluding the most recent month.
-
Volatility: Trailing one-year daily return volatility.
To isolate the similarity signal’s marginal contribution, we use a 2x2 sequential sort. First, we split the large-cap universe at the median based on a traditional factor (e.g., cheap vs. expensive or high profits vs. low profits). Within each half, we split again at the median based on the similarity score (big changers vs. steady language). That gives us four market-cap-weighted portfolios of roughly 250 stocks each, rebalanced quarterly.
The 2x2 matrices in Exhibit 6 tell a clear story. Holding the traditional factor exposure constant, adding the similarity signal improves returns in every single case, without adding meaningful volatility. Sharpe ratios rise uniformly across the board. These findings provide strong evidence that the similarity score captures something genuinely different from traditional factors. (Formal factor attribution also confirms the low correlation, but we’ve omitted those details for brevity.)
Significantly, the similarity signal's payoff is highly asymmetric. The return spread widens substantially among stocks that already look risky on traditional factor measures. Within speculative cohorts — cheap, aggressively investing, unprofitable, high-volatility, and low-momentum stocks — the return spread between large-change and stable-language firms widens to 3.5%–5.3% annually.
This fits the “bad news concealment” thesis cleanly. When management of a fundamentally challenged company is actively rewriting its disclosures, that's often a warning sign, not a green light. For systematic investors, the application is straightforward: use the similarity score as a text-based value-trap filter. Classic value factors identify statistically cheap stocks, but a sizable fraction of those are cheap for a reason. By screening out firms with unstable reporting narratives, investors can sidestep the worst of the bunch (i.e., companies that look like bargains on paper but are quietly hiding structural decay in the fine print). The same logic extends across factor portfolios. Whenever an investor is taking a contrarian or risk-premium bet, layering in the similarity score helps separate genuine opportunities from traps.
Putting It All Together
Unstructured data is a powerful complement to the numbers-based signals that have dominated systematic investing for decades. When integrated with traditional factor strategies, signals extracted from text using NLP can provide valuable diversification and boost risk-adjusted returns.
Our 30-year analysis of the top 1,000 U.S. stocks shows that even a simple NLP technique (measuring year-over-year textual similarity in SEC 10-K and 10-Q filings) generates a meaningful performance spread. Big changers underperformed steady-language companies by about 2.9% annually (-1.5% vs. +1.4%). And the effect isn’t decaying — the most recent decade shows an even wider spread, confirming that investor inattention to dense regulatory text remains a structural feature of markets.
Our 30-year analysis of the top 1,000 U.S. stocks shows that even a simple NLP technique (measuring year-over-year textual similarity in SEC 10-K and 10-Q filings) generates a meaningful performance spread. Big changers underperformed steady-language companies by about 2.9% annually.
Looking Ahead: Will the Signal Survive?
A forward-looking investor might ask, “As AI continues to advance, won't the cost of processing 100-plus-page filings fall dramatically, eroding the advantage?” In principle, yes—at least for the limited-attention component of the signal. But lower processing cost doesn't automatically translate into utilization. The past decade has already seen systematic funds deploy NLP on EDGAR at scale, and far from decaying, the signal has remained strong.
More importantly, attention is only one of three drivers. The bad news-concealment mechanism (in which management and counsel quietly revise risk language to mitigate future litigation) depends on disclosure incentives that are structural, not technological. And the rational-risk-premium component reflects genuine uncertainty, which doesn't disappear just because it can be measured faster. For these reasons, we expect the core signal to persist.
The more interesting question is how the signal will evolve in form. As NLP matures from bag-of-words methods to semantic embeddings and LLM-based change detection, better metrics will capture nuances that Jaccard misses. Or consider what might happen in an extreme but plausible future scenario in which capital is allocated almost entirely by AI systems that systematically read every filing and respond to every disclosure incentive. In that case, even structural inefficiencies would be compressed. We're obviously not there yet, and the 30-year evidence suggests we're farther away than the pace of technology might lead us to believe.
What's Next
For systematic investors with long-horizon portfolios, harvesting slow-decaying behavioral anomalies can be highly rewarding, and using a simple NLP metric to catch these structural shifts is only the beginning. As NLP has evolved from basic vocabulary analysis to context-aware neural networks and LLMs, so too have its applications in finance. In Part 2 of this series, we'll explore how modern deep-learning architectures are further transforming NLP and what that means for systematic investment strategies.
https://www.researchaffiliates.com/legal/disclosures#investment-adviser-disclosure-and-disclaimers
Appendix
Definition of Jaccard Similarity
Mathematically, let represent the set of unique terms occurring in documents , respectively. The Jaccard similarity calculates the size of the intersection divided by the size of the union of the two term sets:
where |A| denotes the cardinality of the set A, representing the number of elements it contains.
Excerpts from Citigroup’s 10-K Filings for 2006 and 2007
Recent 10-Year Results
Subperiod Excess Returns
Annual Rebalancing Results
End Notes
-
The search extended even beyond text itself. Mayew and Venkatachalam (2012), for instance, found that stress or confidence in CEOs' voices on earnings calls carried a signal beyond the transcript.
-
Early text-analysis studies relied on general-purpose sentiment dictionaries, which misread financial language ("liability" is neutral in accounting but negative in everyday use). Loughran and McDonald (2011) built a finance-specific word list to resolve this, and it has since become an industry standard.
-
We stripped out numerical tables (which confuse text analysis) and common filler words such as “an,” “is,” and “the,” following standard practice in the literature as established by Loughran and McDonald (2011).
-
We compared each filing to the same company's filing from the same quarter a year earlier (a 10-Q for Q1 2021 against a 10-Q for Q1 2020, and so on) so seasonal reporting patterns wouldn't contaminate the signal.
-
Risk capital was defined as the amount of capital required to absorb potential unexpected economic losses resulting from extremely severe events over a one-year period. Return on risk capital compared business income with the capital required to absorb the risks.
-
An emergency intervention on November 23, 2008, included a $20 billion capital injection and government guarantees on $306 billion of troubled assets, which came on top of the $25 billion Citigroup had already received through the Troubled Asset Relief Program (TARP) in October. A third rescue followed on February 27, 2009, when the U.S. Treasury converted its preferred shares into common stock, ultimately taking up to a 36% equity stake.
-
On May 5, 2026, the SEC proposed amendments that would allow public companies to elect semiannual reporting (on a new Form 10-S) in lieu of quarterly Form 10-Q filings. The proposal is optional, so adoption is unlikely to be uniform. To the extent companies opt in, however, fewer filings per year would mean fewer year-over-year comparison points for this signal.
-
PSLRA’s safe harbor provisions protect companies from liability for forward-looking statements that prove inaccurate, provided they are accompanied by cautionary language. Management and legal counsel have strong motivation to revise risk factors, adjust forward-looking statement qualifiers, and modify cautionary language — partly to manage litigation risk.
-
This approach produces descriptive statistics averaged across hundreds of overlapping event windows, which is different from a continuous portfolio backtest.
References
Tetlock, P. C. 2007. “Giving Content to Investor Sentiment: The Role of Media in the Stock Market.” Journal of Finance 62:3.
Feldman, R., S. Govindaraj, J. Livnat, and B. Segal. 2010. “Management's Tone Change, Post Earnings Announcement Drift and Accruals.” Review of Accounting Studies 15, 915–953.
Loughran, T., B. McDonald. 2011. “When Is a Liability Not a Liability? Textual Analysis, Dictionaries, and 10-Ks.” Journal of Finance 66:1.
Mayew, W. J., M. Venkatachalam. 2012. “The Power of Voice: Managerial Affective States and Future Firm Performance.” Journal of Finance 67:1.
Cohen, L., C. Malloy, and Q. Nguyen. 2020. “Lazy Prices.” Journal of Finance 75:3.
Lopez-Lira, A., and Y. Tang. 2023. “Can ChatGPT Forecast Stock Price Movements? Return Predictability and Large Language Models.” Journal of Financial Economics, forthcoming.
Eisfeldt, A., B. Hartman-Glaser, E. Kim, and K. Lee. 2026. “Intangible Intensity.” NBER Working Paper No. w34882.
A message from Advisor Perspectives and VettaFi: Discover something new! Click here to register for our upcoming webcasts.
© Research Affiliates
More Mutual Funds Topics >

 Annual Rebalancing Results