Gasoline Prices Rise Amid Geopolitical Tensions
Membership required
Membership is now required to use this feature. To learn more:
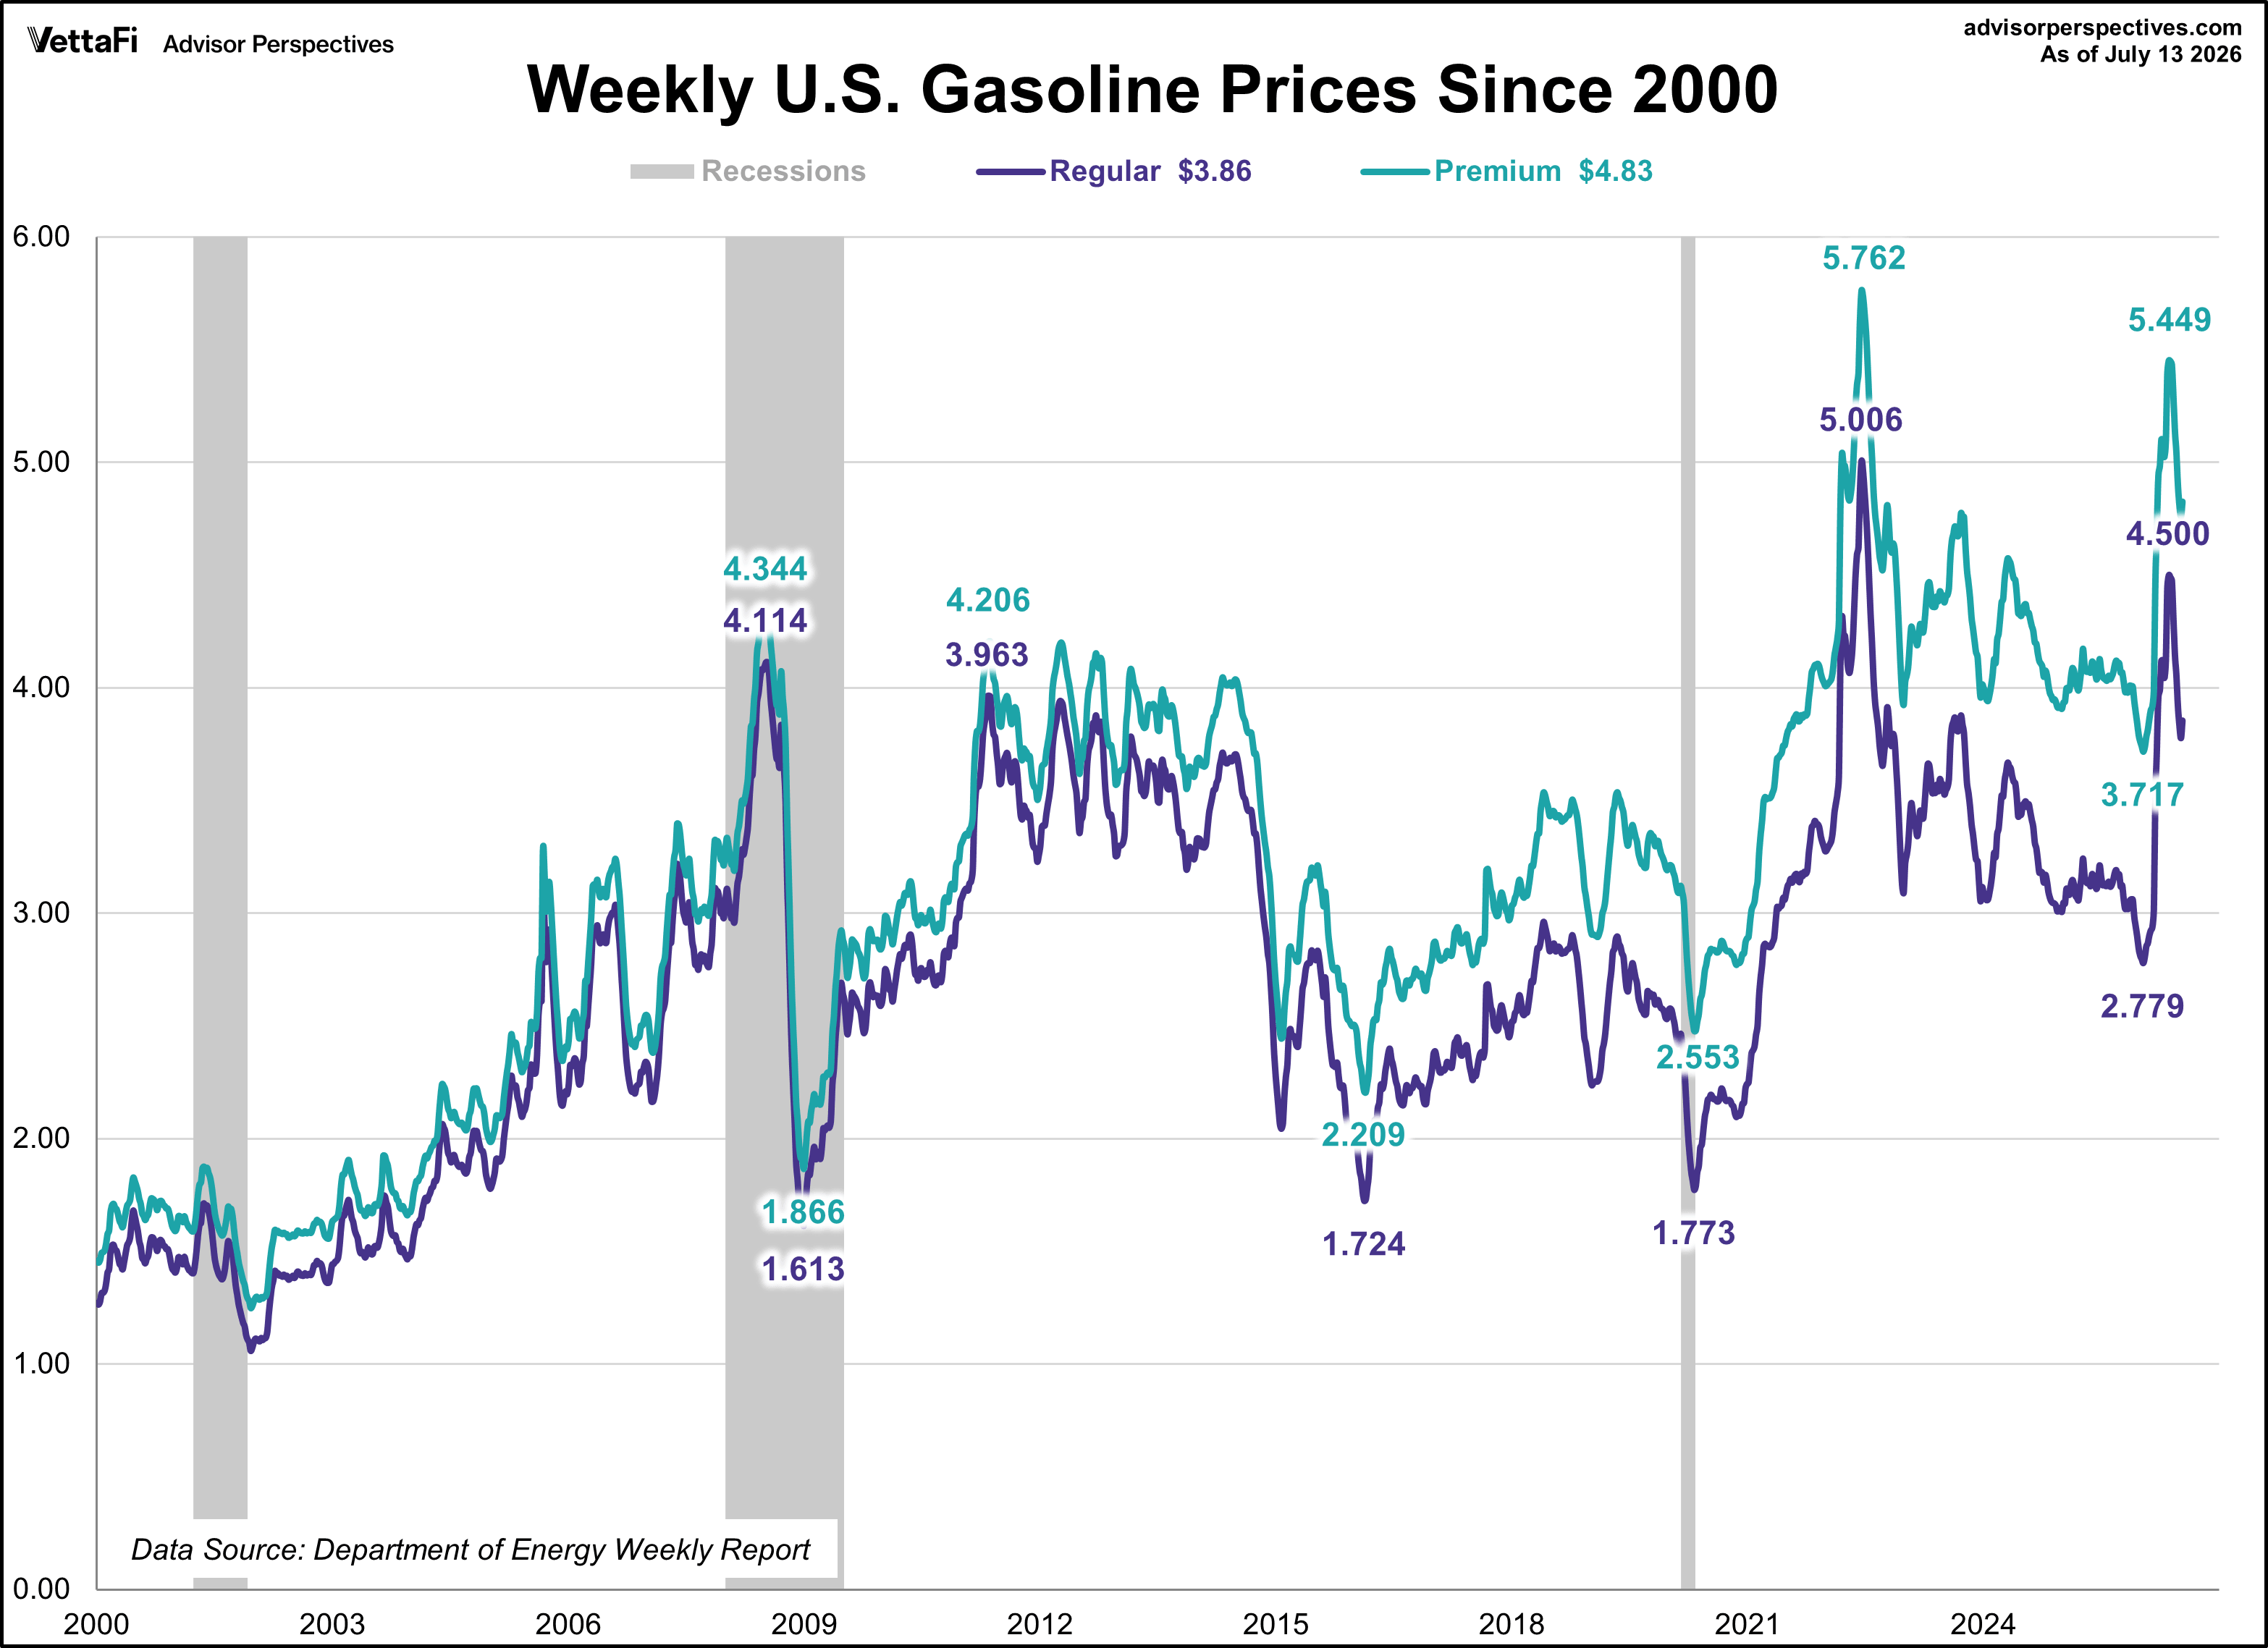
View Membership BenefitsGasoline prices rose for the first time in nine weeks amid renewed geopolitical tensions. As of July 13th, weekly gasoline prices were up 8 cents for regular and increased 7 cents for premium.
Key Takeaways
-
As of July 13th, the national average for regular gasoline is $3.86 per gallon and premium is $4.83.
-
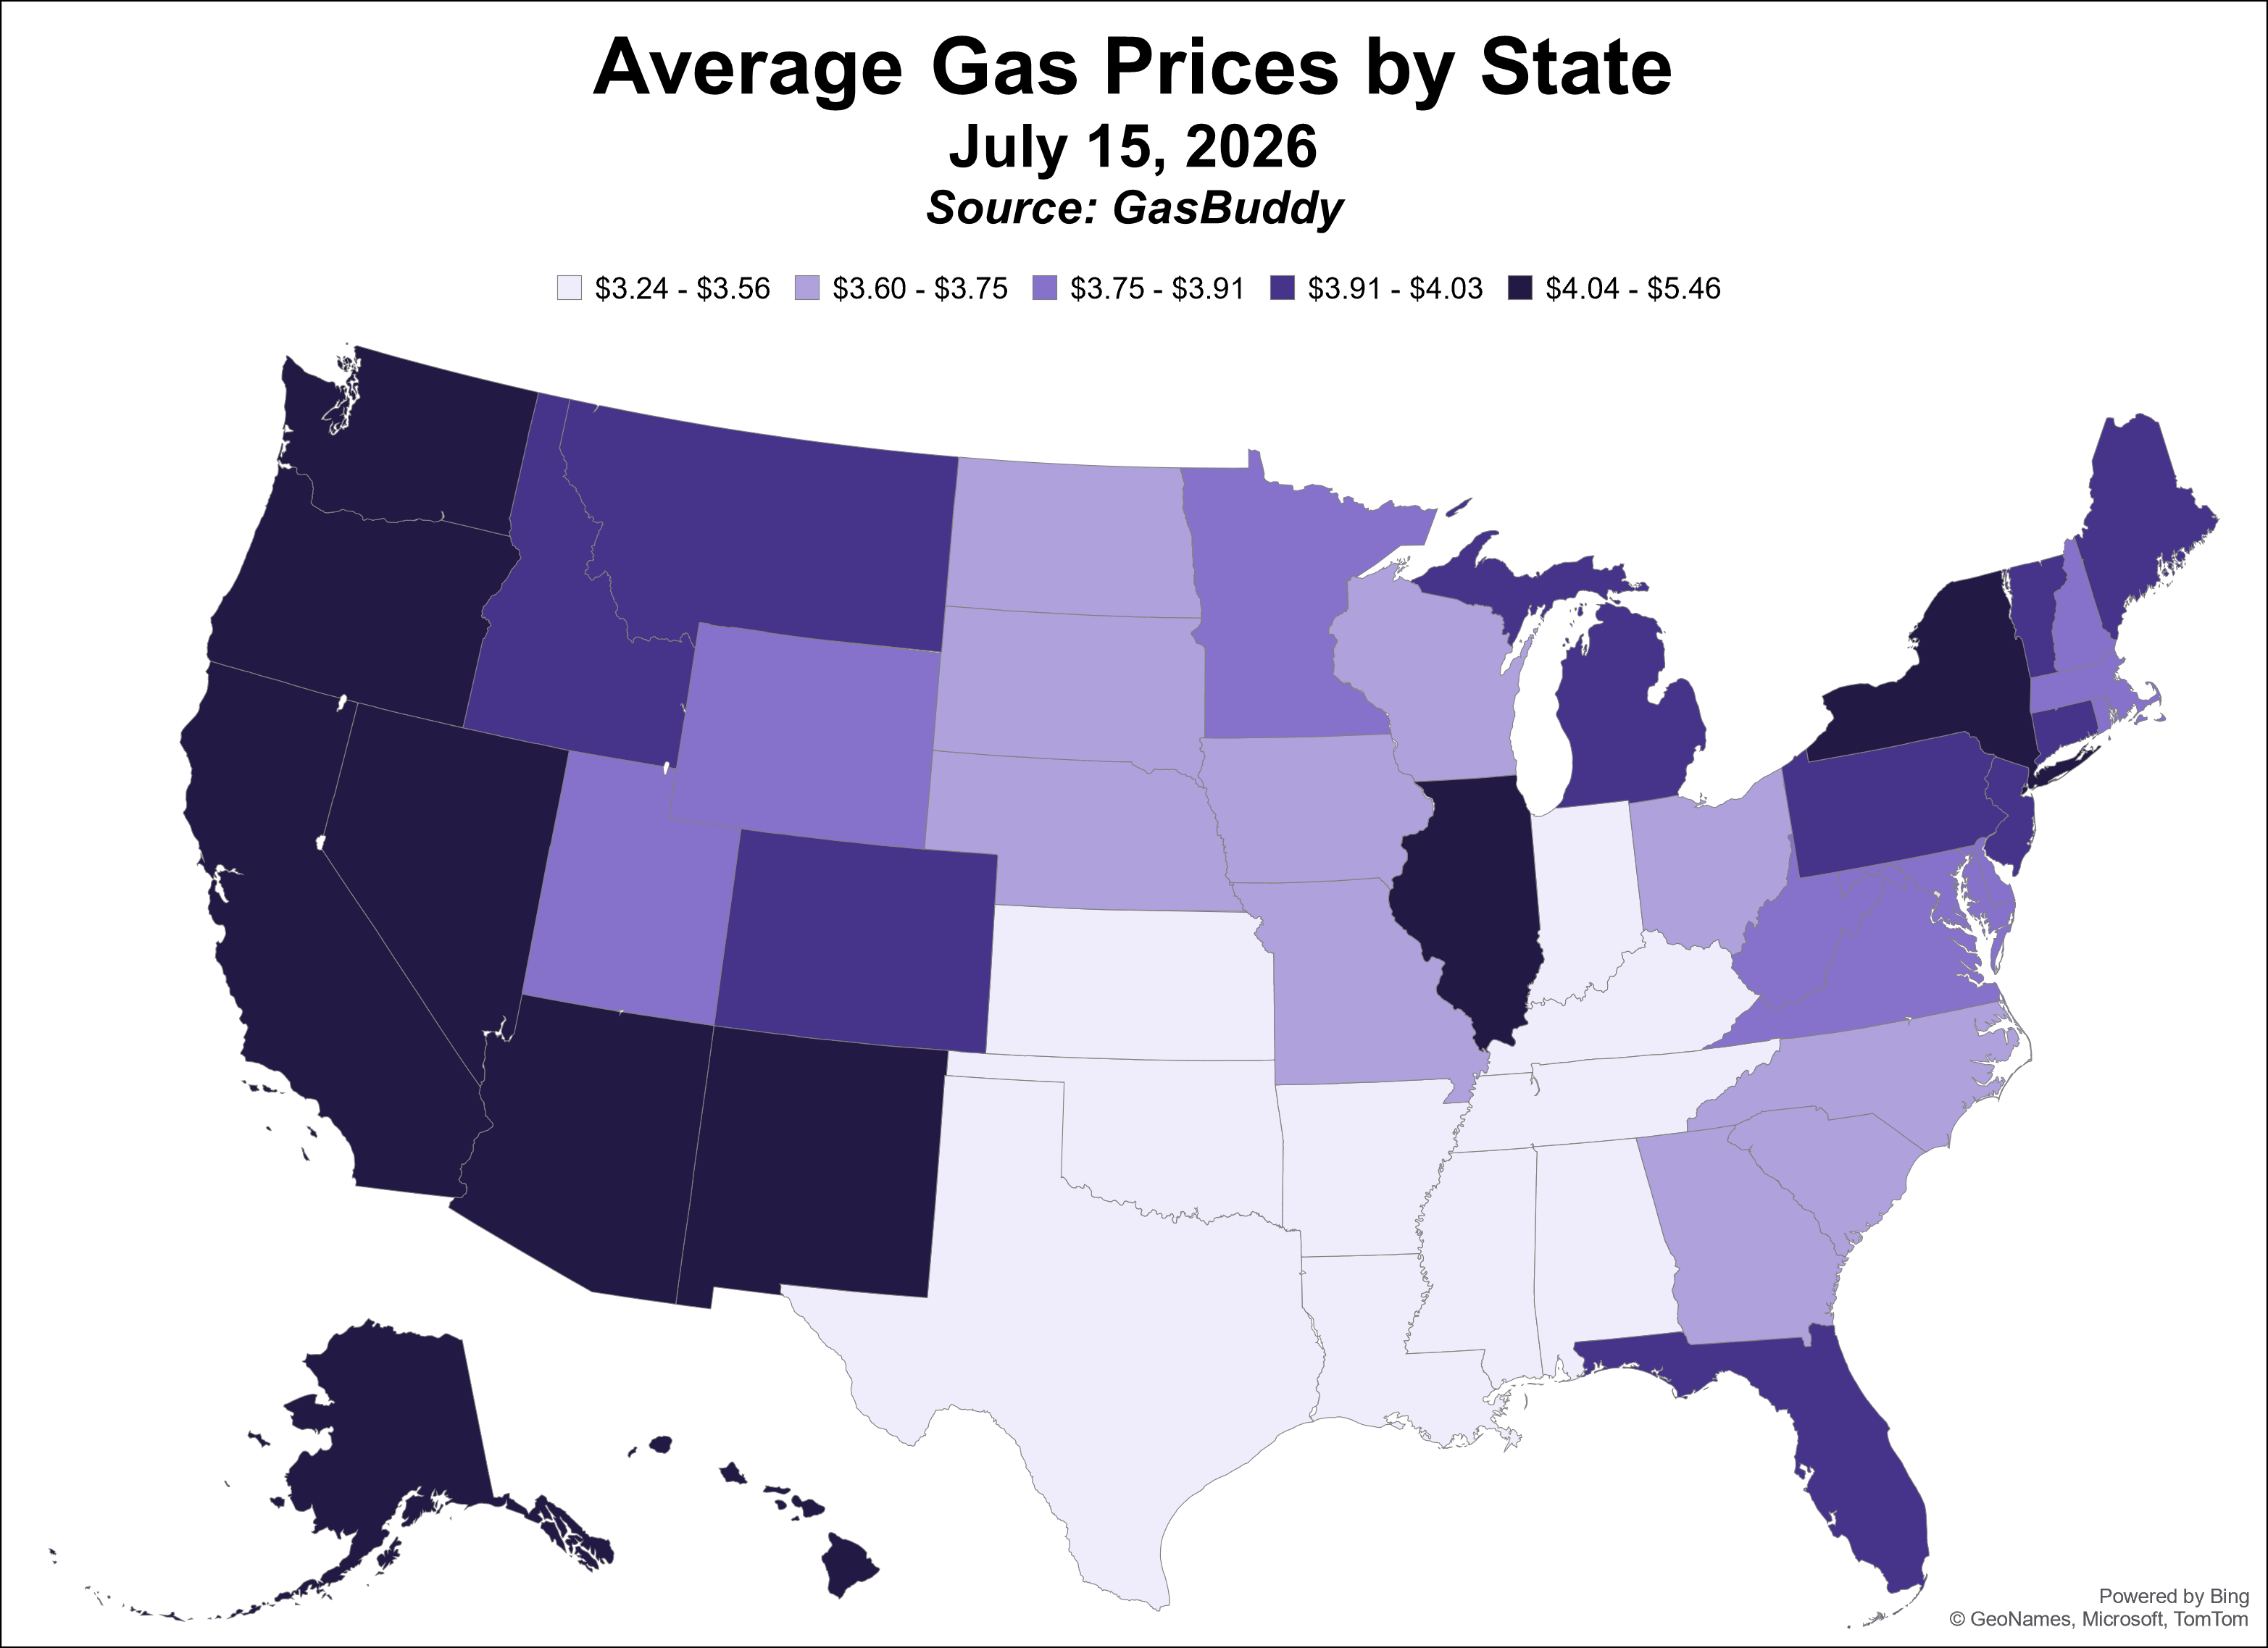
A $2.21 geographic price gap exists between Hawaii's high of $5.45 and Indiana’s low of $3.24.
- West Texas light crude oil rose 14.0% from the previous week.
Currently, the national average for regular gasoline stands at $3.86 per gallon, with premium averaging $4.83. Though down from recent highs, these prices represent a jump since the start of the year, with regular gasoline up 37% and premium up 28%. Compared to one year ago, regular gasoline is 23% more expensive (up from $3.13), while premium has seen a 19% increase (up from $4.04).
Gas Prices by State and Regional Disparities
According to GasBuddy, regional price disparities have widened significantly, leaving a $2.21 gap between the nation’s highest and lowest averages. Hawaii currently holds the highest average for regular gas at $5.45, while Indiana offers the cheapest at $3.24. Despite every state in the nation averaging over $3.00 per gallon, a clear geographic divide has emerged.
The West Coast continues to lead the nation in fuel costs, with two states averaging over $5.00 (Hawaii and California). In the middle tier, there are now ten states primarily across the West and Northeast falling into the $4.00 to $5.00 range. Conversely, there are now thirty-eight states below the $4.00 threshold, with these lowest averages concentrated mainly in the South and Midwest.
Behind Gasoline Prices: Components and Inflation
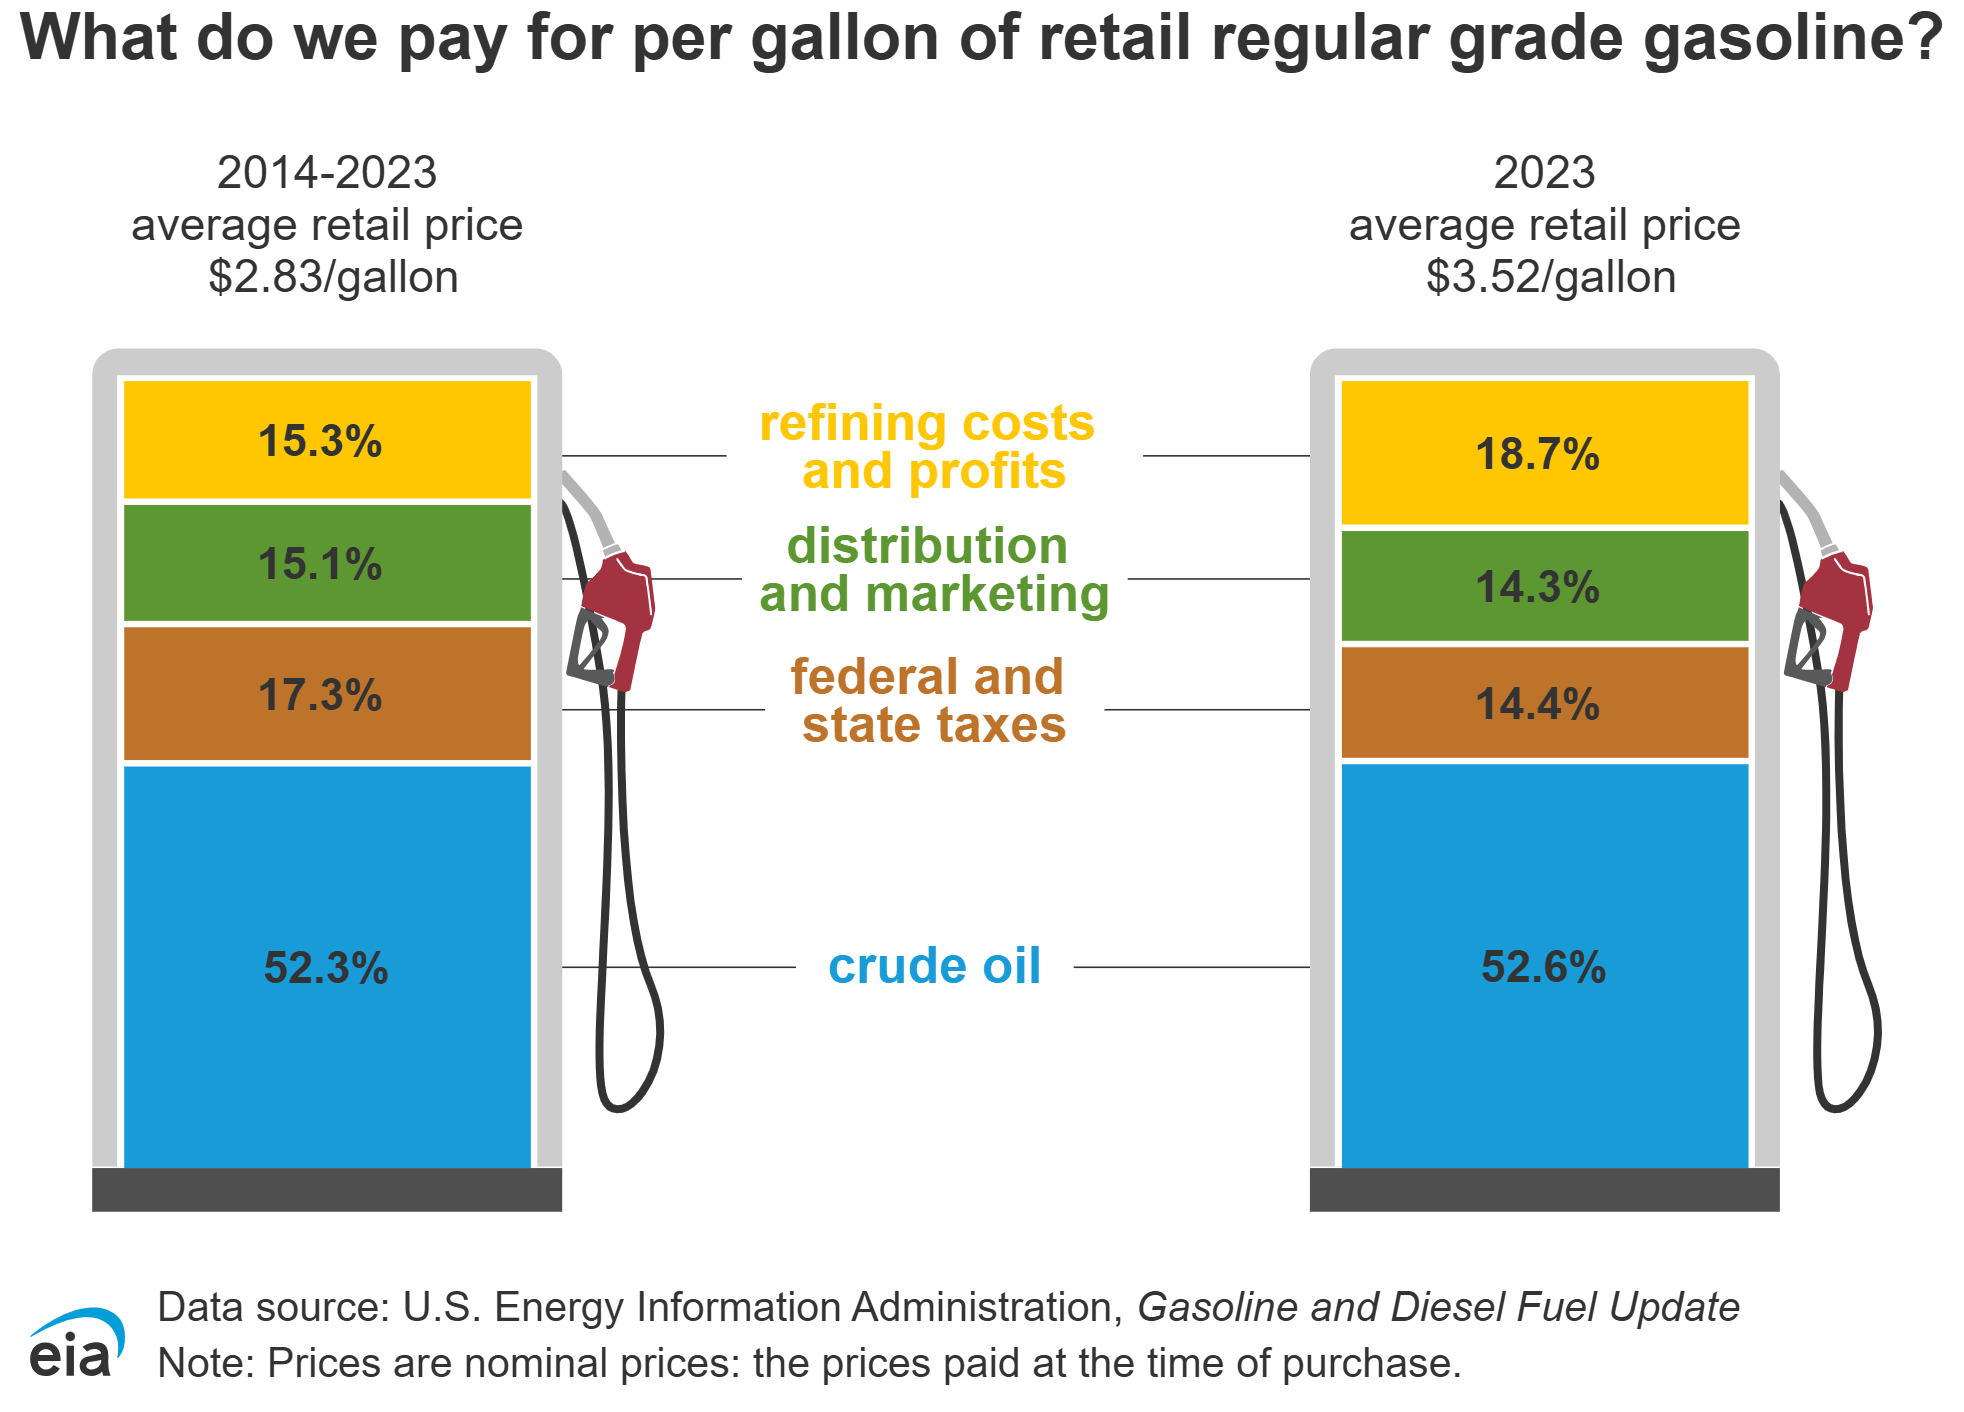
To understand these surges, it is helpful to look at the "price at the pump" as a sum of its parts. The retail price of gas is made up of four main components: 1) cost of crude oil, 2) refining costs and profits 3) distribution and marketing costs and profits, and 4) taxes.
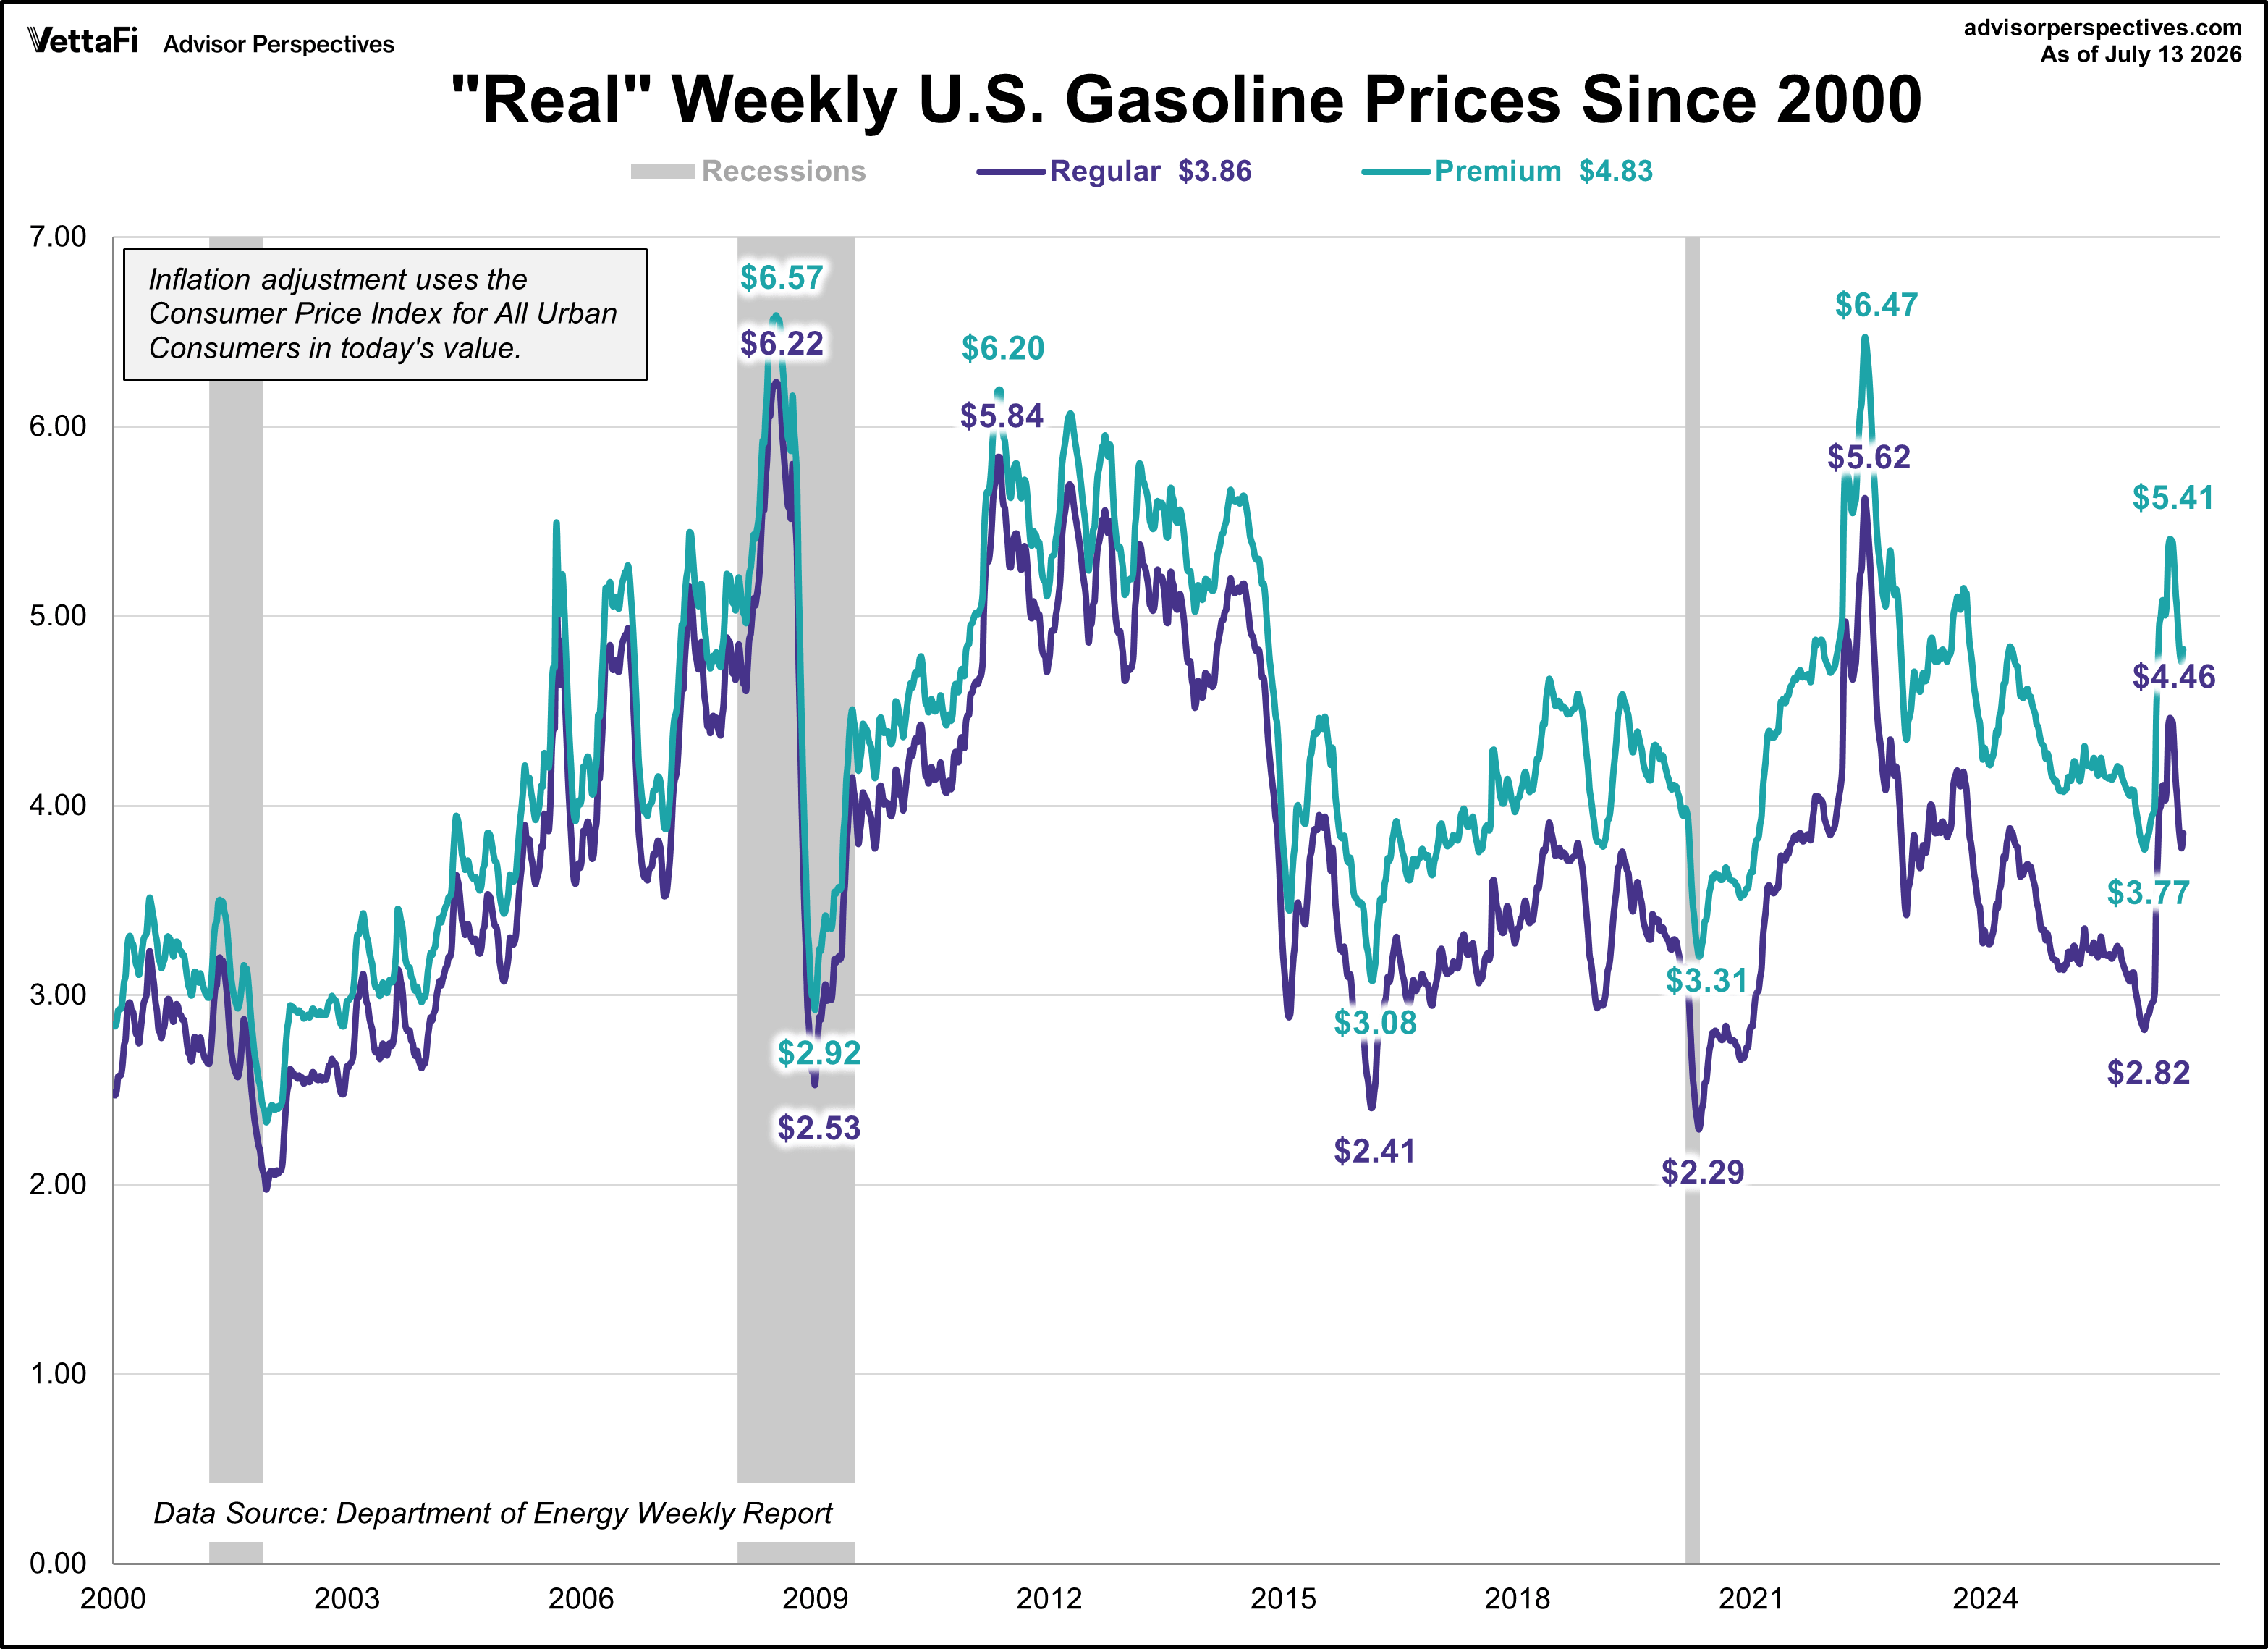
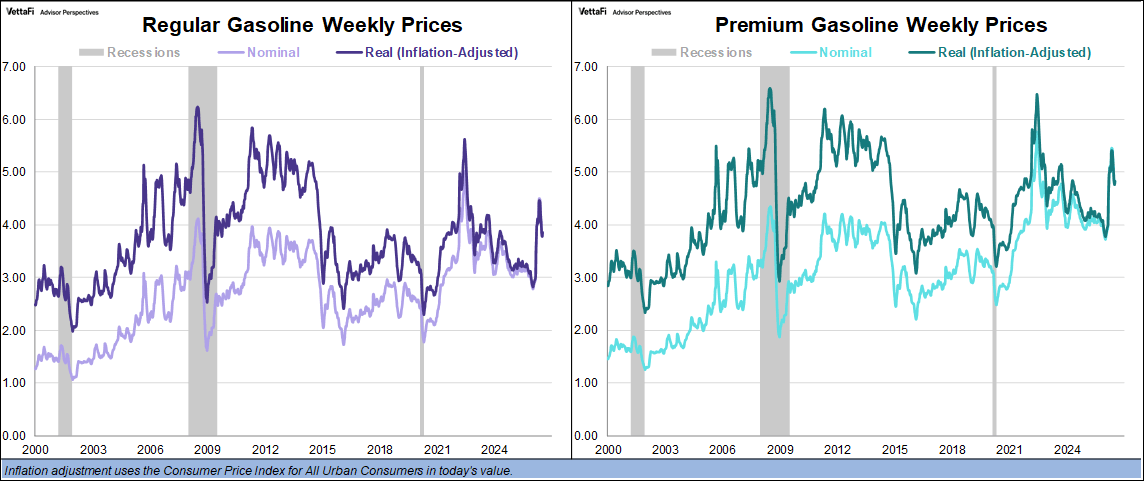
The volatility in these components, particularly crude oil, has been clearly reflected in recent years in both the Consumer Price Index (CPI) and Personal Consumption Expenditures (PCE). In the following chart, we take a look at gasoline prices adjusted for inflation to show the "real" cost to consumers.
For an easier way to visualize these effects, this next chart overlays the nominal price with the inflation-adjusted "real" price for both regular and premium gasoline.
For additional perspective on how energy prices are factored into the CPI, see Inside the Consumer Price Index.
Crude Oil Market Trends
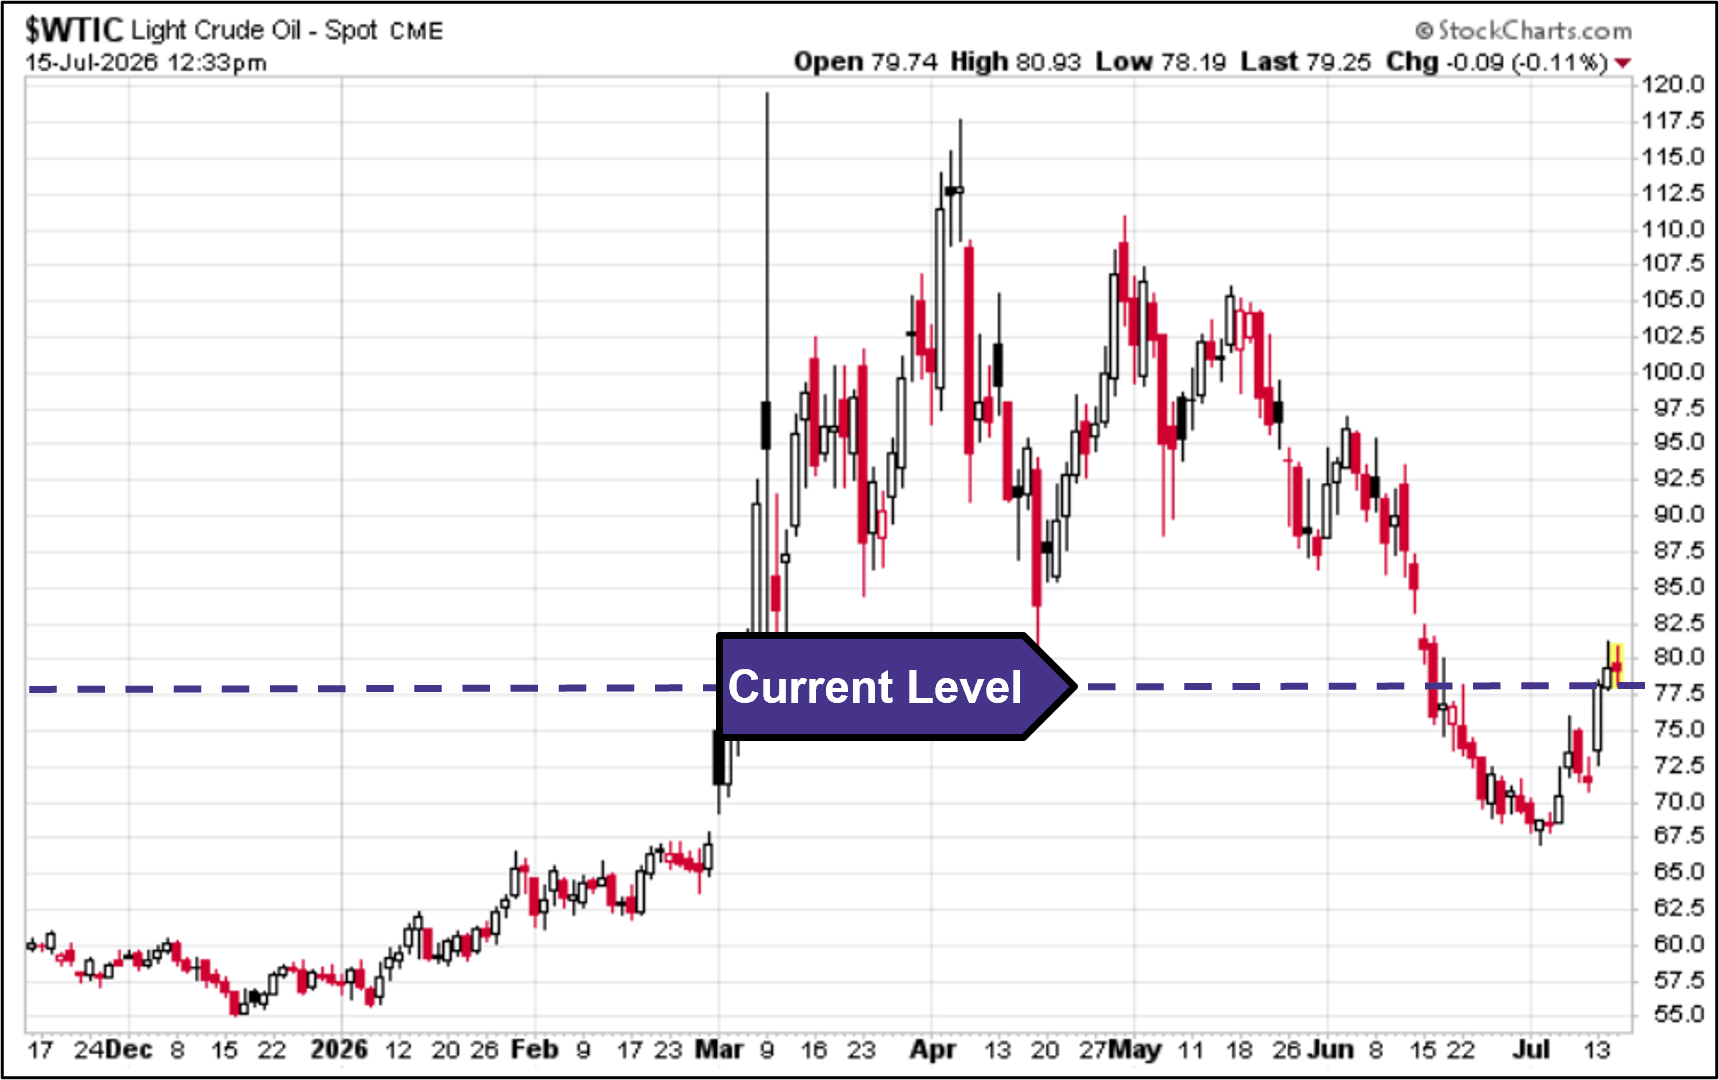
This next chart shows the West Texas light crude oil price over the past 8 months. As of July 13th, WTIC end-of-day spot price for crude oil closed at $78.14, a 14.0% increase from the previous week.
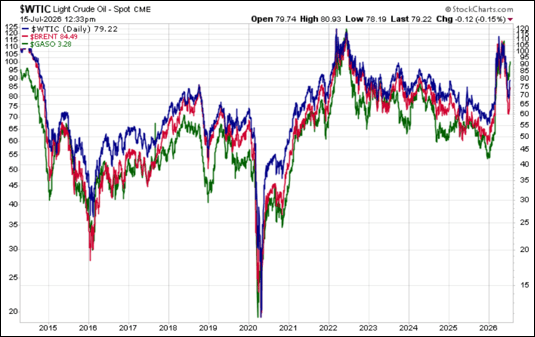
The final chart provides a monthly overlay of West Texas light crude, Brent crude, and unleaded gasoline end-of-day spot prices, showing the tight correlation between global benchmarks and domestic retail costs.
ETFs associated with gasoline WTIC crude oil, and Brent crude oil include: United States Gasoline Fund LP (UGA), United States Oil Fund LP (USO), United States Brent Oil Fund LP (BNO), and Invesco DB Oil Fund (DBO).
Membership required
Membership is now required to use this feature. To learn more:
View Membership BenefitsSponsored Content
Editorial Calendar
View Full Calendar Eastern Time Zone
+ Add the editorial calendar to your Google Calendar.
Upcoming Virtual Events View All